The objective of this project was to develop a methodology to select high quality IRA stocks. Let's first explore IRAs and why they are so important.
What is an IRA?
An IRA or individual investment account is the money you set side for retirement. There are a few different types, so lets give a quick comparison of the Traditional vs Roth.
The main difference between a Traditional and Roth IRA lie with the tax benefits. In the traditional IRA you are able to reduce your taxes in the present by putting the funds in your IRA, allowing you to report a lower income and pay less income tax. The Roth in contrast allows you to pay taxes now, or include the funds invested in your reported income but when you withdrawal you do not have to pay taxes. This is a huge advantage because you don't have to pay taxes on your compounded money.
What is power of compounding?
An important consideration when making retirement account choices is the principle of compounding. Compounding refers to the invested capitals ability to compound on itself.
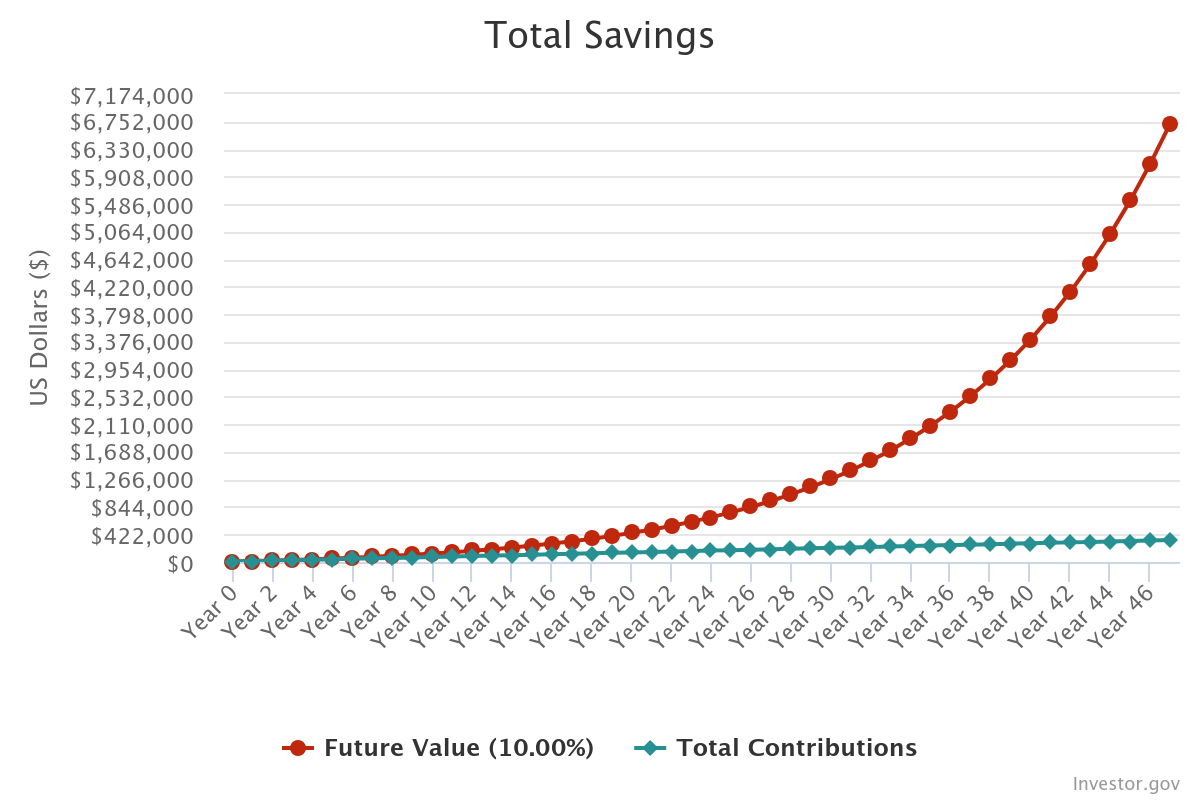
47 years of compounding at a 10% rate
Wow an impressive $6,717,718.47 future value while only contribution $7000 a year (583.33 a month) or $335,812.
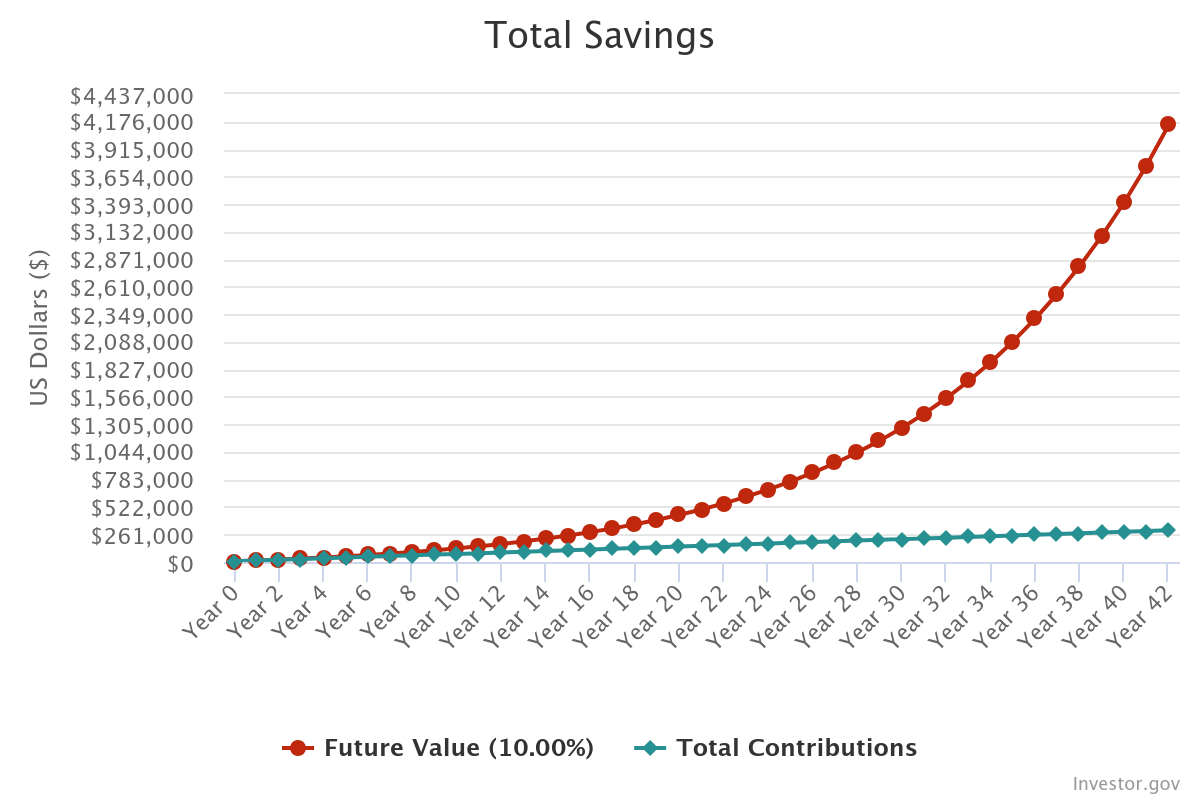
42 years of compounding at a 10% rate
In this scenario you still managed to save $4,144,654.29 of future value while only contribution $308,832.
So simply by no investing the first 5 years, you effectively lost out on $2,573,064.18 which was created by the first 26,980 invested. (335k - 308k)
Important Considerations
If you were paying close attention to the charts you would notice that the total value did not reach 1 million until just a few years before year 30 - in other words the compounding doesn't take effect for a good bit, you will not see millions in your account tomorrow. To receive the affect of compound you must be consistent and diligent with your investments.
A 10% return is the market average small changes in the compounding rate can lead to big jumps in future value. For example a 15% return from ages 18-65 would return $38,173,059.30. This is much more than the 6 million at 10%. But the same principle applies in the reverse, a 5% return is only $1,315,465.27. The key here is to be careful and not drop below the market rate.
Selected Stocks
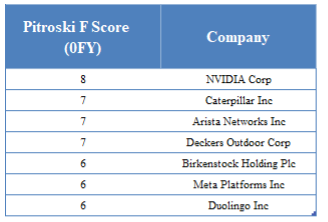
After developing my strategy and screening and ranking the stocks I have developed my top 7 stocks for 2025. (7 stocks as the max contribution is 7,000 for an individual filer, hence 7 bets of 1,000 each)
My top stocks for 2025 ranked by Piotroski F Score:
Piotroski F Score
Company
8
NVIDIA Corp
7
Caterpillar Inc
7
Arista Networks Inc
7
Deckers Outdoor Corp
6
Birkenstock Holding Plc
6
Meta Platforms Inc
6
Duolingo Inc
Appendix
Warren Buffett and the Interpretation of Financial Statements
The book is split up into 3 sections, an introduction and then a section on each of the 3 financial statements (Income Statement, Balance Sheet, and Statement of Cash Flows) with each of the important line items defined and related to Buffet's investment strategy.
Introduction to Value Investing
Value investing is purchasing durable companies and holding them for a long time. While complex computer systems investing has taken over the market, exceptional companies make unique low-cost products or services that occupy a spot in the consumer's mind.
Higher durability reflects less expenses which means more cash and less debt
A good company has good margins, little debt, low R&D
Consistent earnings and growth in earnings are key indicators
Income Statement Analysis
Revenue - Expense = Profit
Companies fall into two categories:
Companies with long term competitive advantage
Mediocre companies
The gross profit margin of a durable company should be about 40%
Gross Profit Margin = Gross Profit / Total Revenue
SG&A should be less than 30% of total expenses
Lower R&D spending often indicates a more profitable industry for shareholders
Low interest expense signals low debt dependency
Companies that need debt to operate aren't as competitive as those generating regular cash
Look for consistent positive net earnings
Be cautious of gains or losses on asset sales - they're short-term events
Balance Sheet Indicators
Assets = Liabilities + Shareholders' Equity
Examine cash position trends over the past 7 years
Inventory increases should correlate with revenue growth
Look for a lower percentage of net receivables to gross sales
Lower PP&E costs are often preferable
Lower-tech industries often have easier competitive landscapes
Brand value and name recognition are crucial assets
Lower ROA with higher assets might indicate strong entry barriers
Very high ROA might signal competitive vulnerability
"Little or no long-term debt often means a good long-term bet"
Debt to Shareholders' Equity Ratio should be less than 0.8
ROE = Net Earnings / Shareholders' Equity
Cash Flow Statement Insights
Focus on operating cash flow strength
Evaluate investing activities carefully
Capital expenditures should be less than 25% of net earnings
Consider the tax implications of dividends
Stock buybacks can increase per-share value
Durable Competitive Advantage
The Equity Bond theory values the return of the EPS on the purchase price and projects a growth rate for the EPS. The calculation takes the original share price divided by projected EPS after applying the growth rate.
Example with Coca-Cola: In the late 1980s, Warren bought shares for $6.50 with pre-tax earnings at $0.71. By 2007, Coke was trading between $45 and $64 with pre-tax earnings at $3.96.
Bloomberg Terminal
I am very fortunate that I was exposed to the Bloomberg terminal in my junior year at the University of Pittsburgh. I quickly realized this was one of the highest value skills I could learn early on. Below I have done my best to capture the exact methodology I used to screen these stocks.
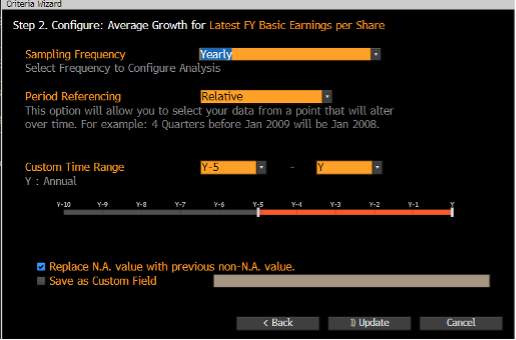
EQS Screen Methodology
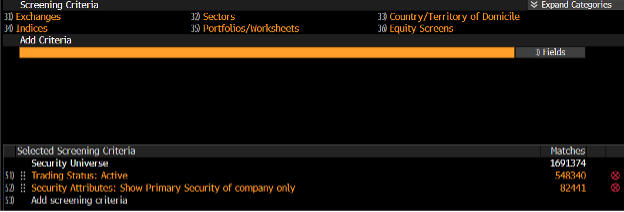
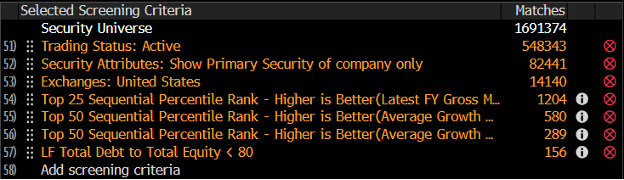
The initial screen was designed to identify the highest quality stocks using the following criteria:
EQS Bloomberg
Blank EQS
US Traded Securities - Focusing on domestic market exposure
Top 25% of Operating Margin - Identifying companies with superior operational efficiency
Debt/Equity Ratio below 0.8 - Maintaining conservative leverage levels
My EQS
My EQS
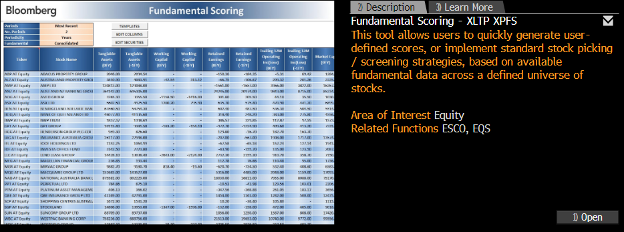
Fundamental Scoring Analysis
After applying the initial screening criteria, I used Bloomberg's fundamental scoring analysis Excel template to further evaluate the remaining securities. This systematic approach helped identify the stocks with the highest potential based on multiple fundamental factors.
Bloomberg Scoring
The 156 securities that passed the initial screening were then analyzed using this scoring system to identify the top-ranked stocks with the highest overall scores.
My EQS
Key Benefits of Bloomberg Terminal Analysis
Access to comprehensive financial data and analysis tools
Ability to screen stocks using multiple sophisticated criteria
Integration with Excel for detailed fundamental analysis
Real-time market data and company information
Send me emails about this
Subscribe to my email list to receive updates about this.